01The beginning
Data taking shape
My journey began by creating Power BI dashboards, transforming information into clearer, more useful analysis.
Hello, I am
I transform data and industrial needs into clear, efficient digital solutions that support decision-making.

About me
A journey built across data, automation, and development — always connecting real problems to practical solutions.
My journey began by creating Power BI dashboards, transforming information into clearer, more useful analysis.
I expanded my knowledge of Python, Excel, SQL, and web development to organize information, improve traceability, and reduce manual tasks.
I am a junior developer and a Systems Analysis and Development student interested in software, data, and process automation.
I like to understand the problem before building the solution. I am curious, dedicated, and committed to learning and creating projects that deliver real results.
Skills
Technologies used to create dashboards, analysis, and applications for industrial environments.
Select an icon to explore the technology and how I use it in my projects.
Projects
Projects that combine development, data, and industrial knowledge.
Project 01
Full Stack Development
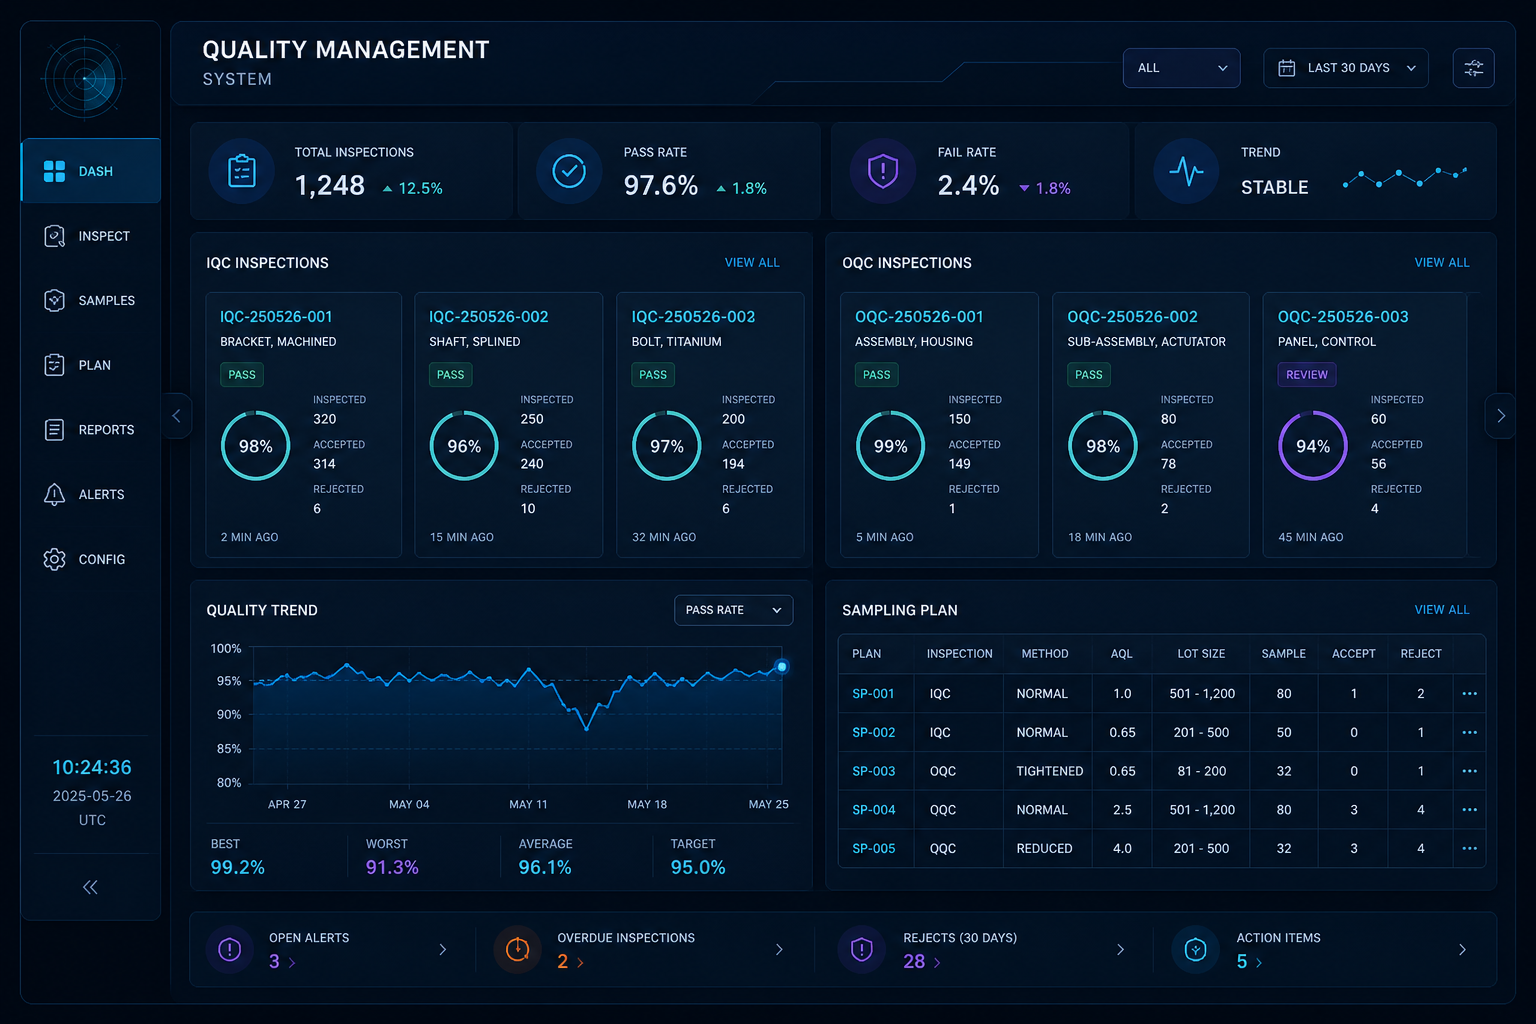
Quality plans and inspections
Full-stack application for managing quality plans and inspections, digitizing IQC and OQC records, tracking indicators, and generating reports.
Project 02
Business Intelligence
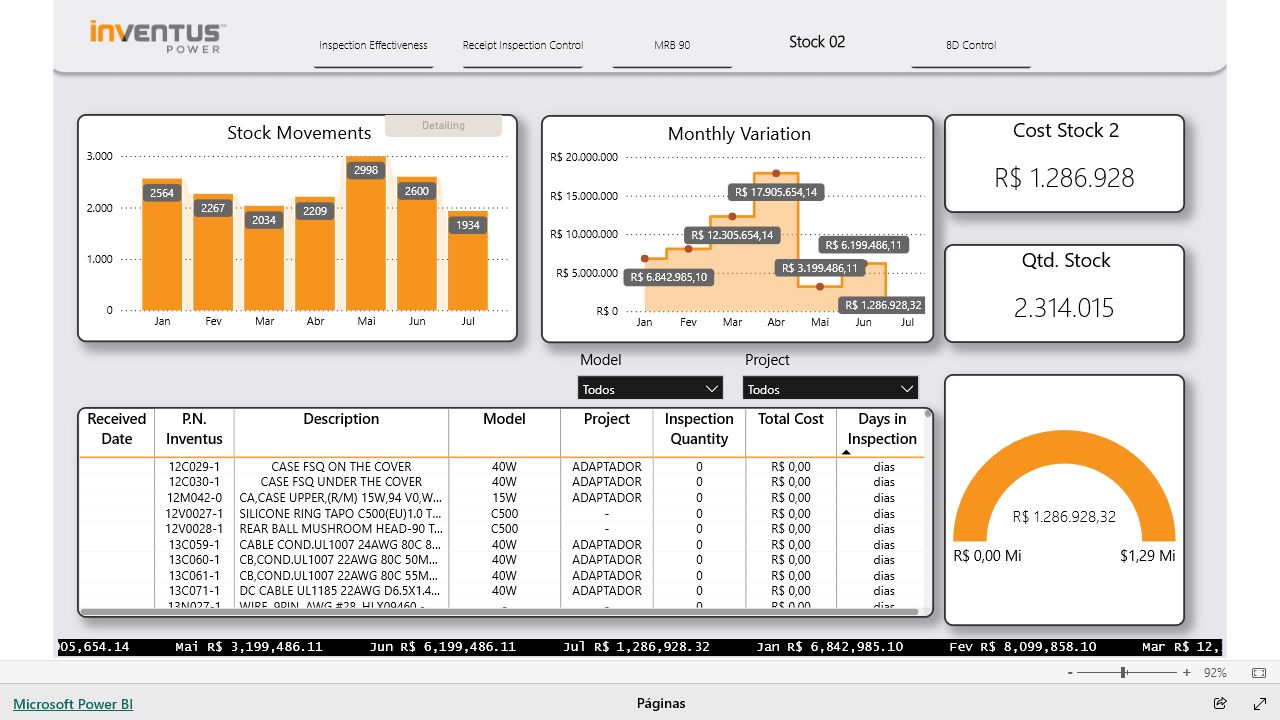
Financial and operational control
Dashboard for monitoring non-conforming materials, financial impact, inventory movements, and monthly cost variation.
Project 03
Data Analysis
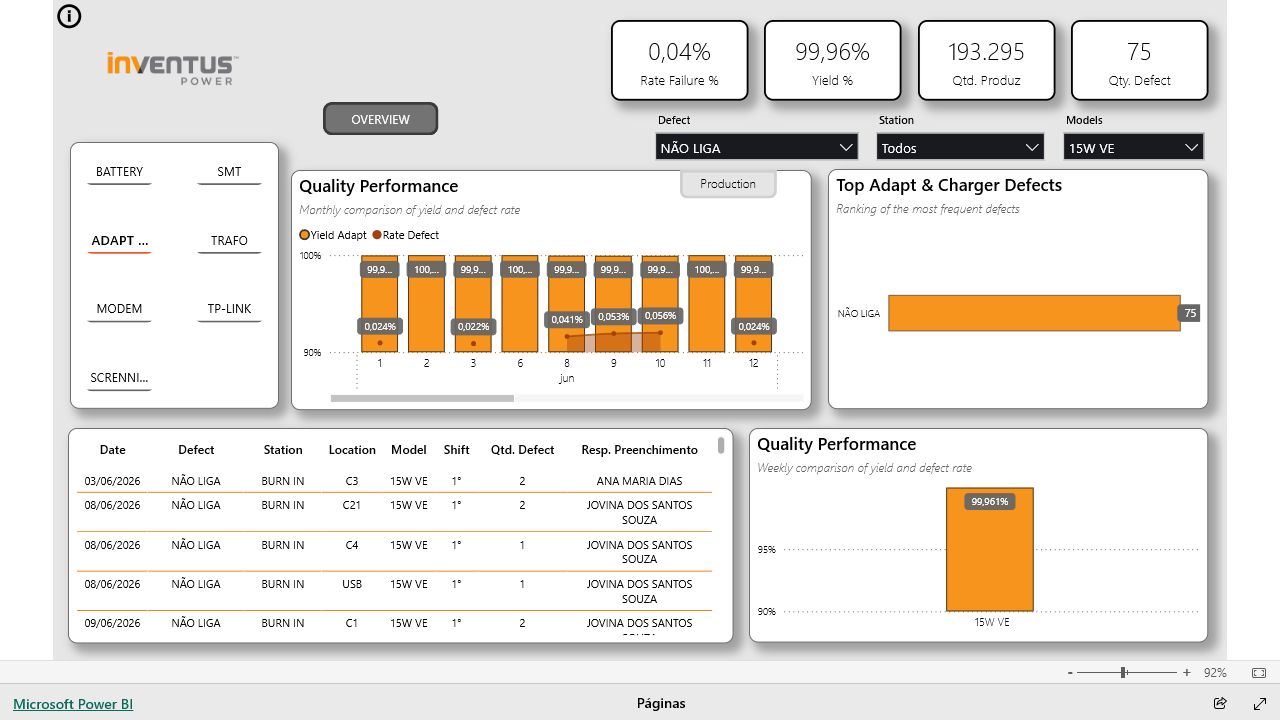
Yield and defect monitoring
Dashboard for tracking production, defects, yield, fail rate, and the main issues identified for each model.
Project 04
Automation and Computer Vision
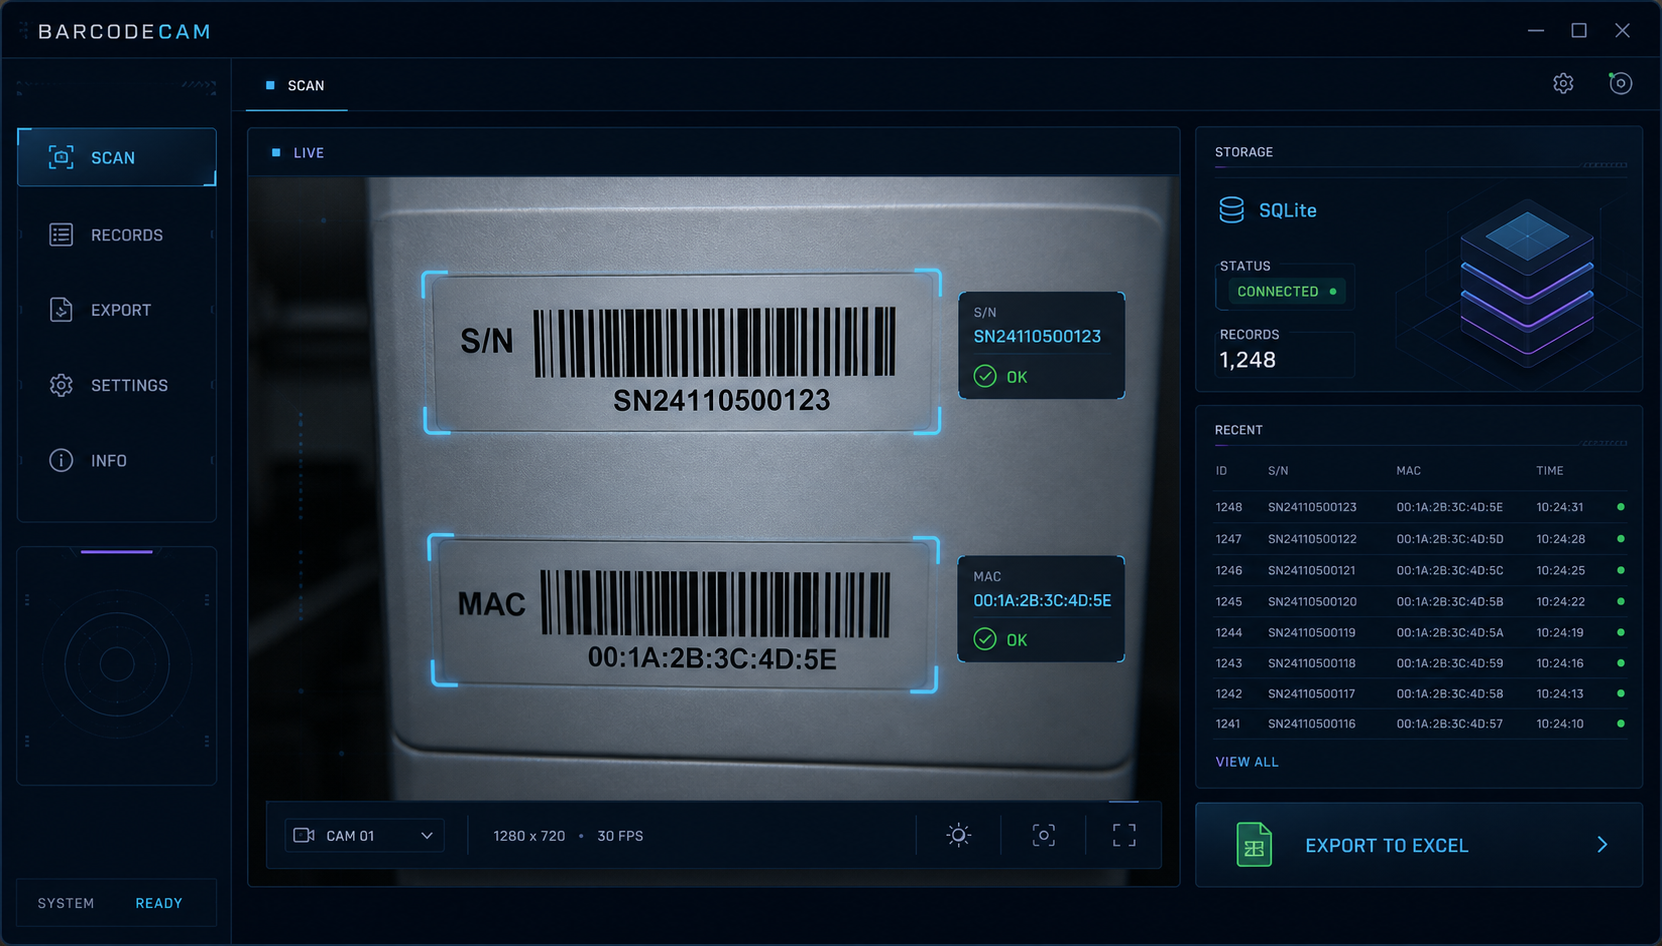
Automated camera-based reading
Python application that uses a camera to recognize S/N and MAC barcodes, validate readings, store them in SQLite, and export records to Excel.
Project 05
Full Stack Development
Offline inspections and traceability
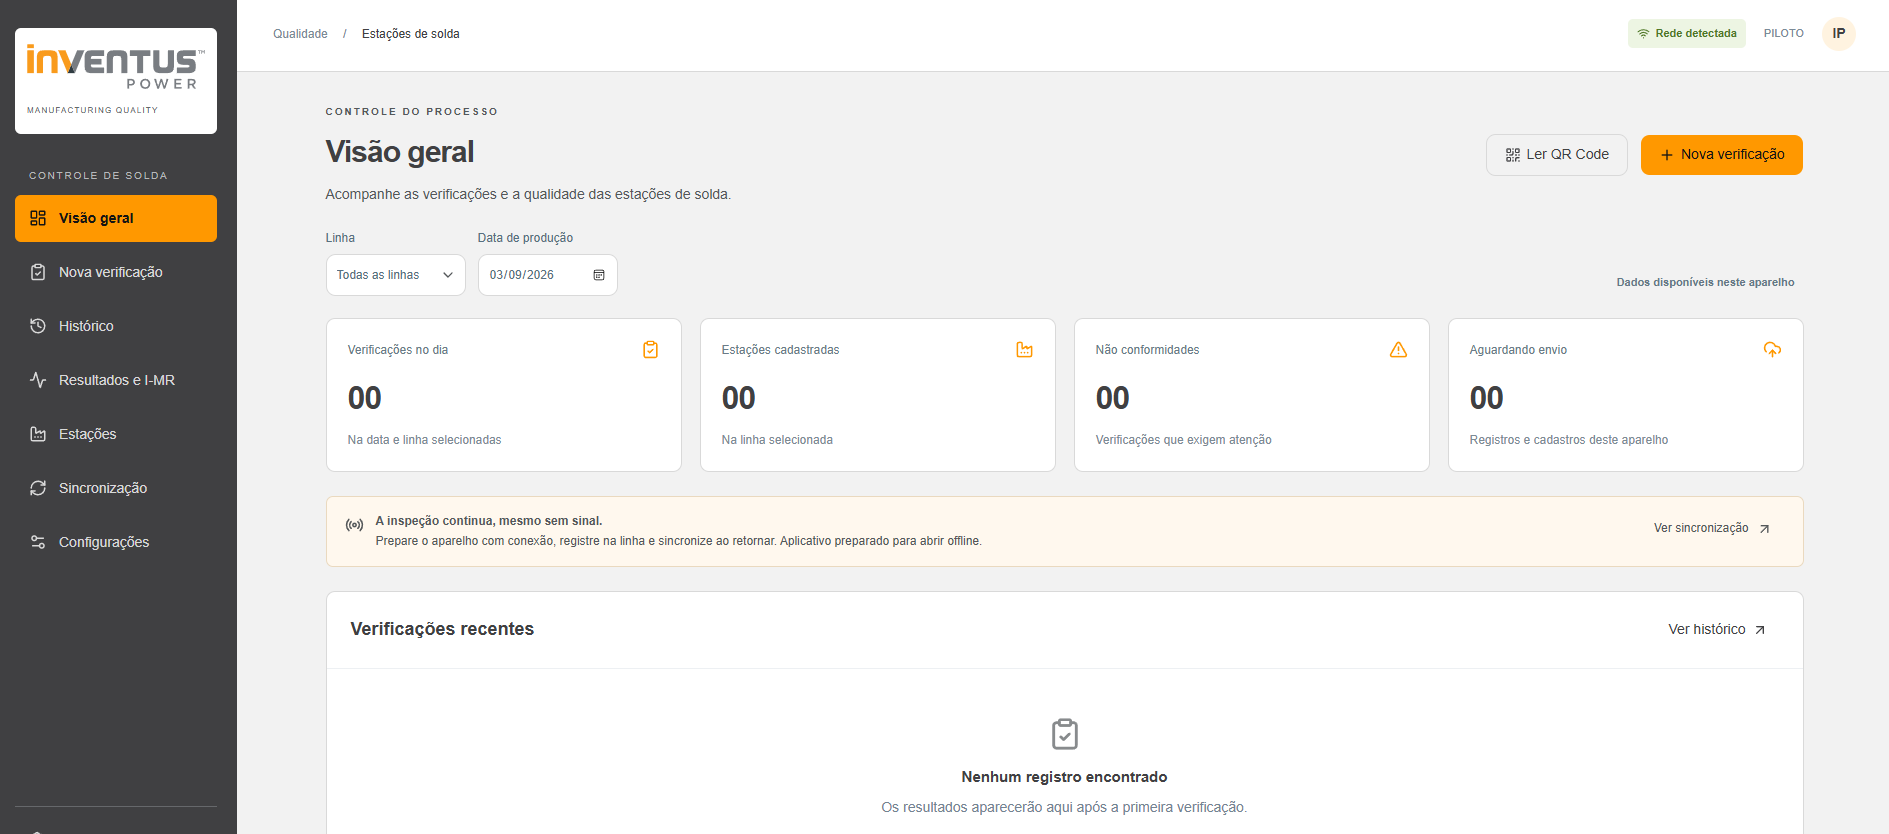
Quality process digitization pilot for soldering station inspections, with a five-item checklist and temperature, resistance, and residual voltage records.
Contact
I am open to opportunities, collaborations, and projects involving development, data, and process improvement.